Creating and Maintaining Inspection Logs for Tracking Hive Health Data
This post contains affiliate links. As an Amazon Associate, I earn from qualifying purchases at no extra cost to you.
Most beekeepers who lose a hive in winter cannot explain exactly when it started failing. They remember the last inspection. They know the colony seemed fine six weeks before. But they cannot pinpoint the week the population curve began dropping, when the queen first showed erratic laying, or whether the varroa load was climbing steadily from late July onward. That gap between “it was fine” and “it’s gone” is precisely what consistent inspection records close.
A hive inspection log is not a formality reserved for commercial operations or overachieving hobbyists. It is the baseline you compare every future visit against. Without one, every decision you make at the hive is disconnected from every decision you made before it. You are reacting to a single snapshot with no context for whether what you are seeing is a new development or a three-week trend. With a systematic log, patterns emerge that stay invisible to memory alone: slow population decline across midsummer, brood degradation that signals a failing queen weeks before the colony goes queenless, mite loads that crept past treatment threshold while you were watching the wrong indicators.
This guide covers what to record, how to structure your system, how to layer in quantitative data like weight and temperature, and how to turn a stack of notes into actionable colony management decisions. Whether you manage one hive or a small backyard apiary, consistent logging is the single highest-leverage habit you can build in your first few seasons.
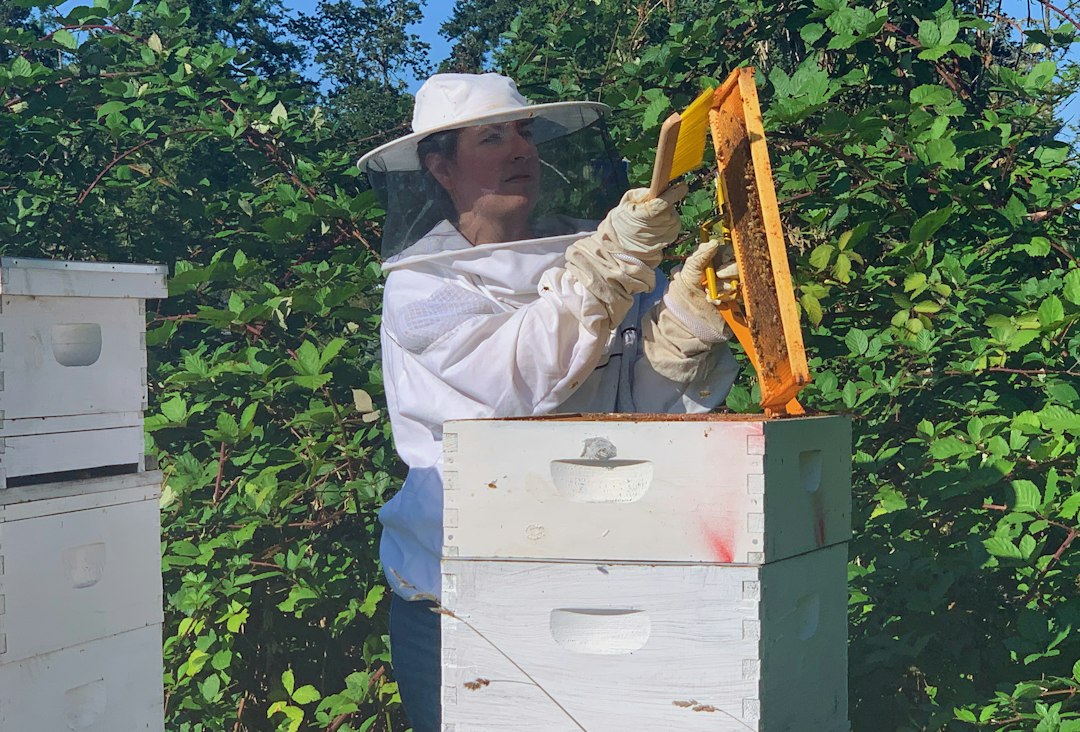
Photo by Melissa Askew on Unsplash
Why Consistent Hive Inspection Logs Change Your Outcomes
The Bee Informed Partnership, which has tracked U.S. colony losses annually for over a decade, consistently finds that hobby-scale beekeepers suffer higher loss rates than commercial operations managing thousands of colonies. The gap is not primarily a knowledge problem. The books, courses, and extension guides are widely available. The gap is largely a monitoring problem: commercial operations inspect on a schedule, record what they find, and act on data trends. Most hobby beekeepers rely on memory and general impressions that degrade rapidly between visits.
A log does three things that memory cannot. First, it captures the state of the colony in enough detail that you could reconstruct the visit months later. Second, it creates a time-series record that reveals trends. A single data point tells you almost nothing about trajectory; four inspections across a nectar flow tell you whether a colony is building, stable, or declining. Third, it enforces structured observation. Filling in a form with a field for brood pattern quality forces you to actually evaluate brood pattern quality rather than registering a general “looks fine” impression and moving on.
For new beekeepers, logs also serve as a learning archive. Your notes from the first spring become a reference for what a healthy colony looked like in your specific location at that specific point in the season. That context is not in any book, and you will not retain it accurately in memory two seasons later. A queen that became progressively harder to find across four consecutive inspections? Your log shows you the timeline. A varroa load that went from 1.2% to 3.8% between June and August? The inflection date is in the records, which tells you whether your treatment window was correct.
Recording Your Hive Data: What to Record and How to Inspect
Effective logs are specific without being burdensome. The goal is enough data that future you can understand the colony’s state, not a complete narrative of every frame. These are the fields that consistently earn their place across a full season:
Date, time, and conditions. Temperature, cloud cover, and wind level matter because they affect bee behavior. A defensive colony on a cold, overcast morning is normal. The same behavior on a warm, sunny afternoon in July is a warning signal. Without weather context, temperament data is nearly uninterpretable.
Queen status. Seen or not seen: fill this field every time, even when the answer is uncertainty. If you cannot locate the queen, note whether eggs are present. Fresh eggs indicate queen activity within the past three days, which is the practical substitute for a direct sighting. Note the presence of any queen cells, distinguishing between emergency cells on the face of frames, swarm cells along the bottom bar, and supersedure cells in the center of the brood comb.
Brood quality. Record the number of frames of brood and the quality of the capping pattern: solid, slightly spotty, or scattered. Note all three brood stages if present: eggs (tiny, white, upright in the base of cells), young larvae (c-shaped, floating in royal jelly), and capped brood (uniform tan cappings for healthy worker brood).
Population. Estimate frames of bees (roughly 80% frame coverage on both sides counts as one full frame of bees) and note general temperament.
Health indicators. Any visible varroa on drone brood when opened. Results of any mite wash or sticky board count, with date and method. Visual signs of disease: sunken or discolored cappings suggesting American foulbrood, chalk-white or black larvae indicating chalkbrood, or deformed wings on adult bees as evidence of Varroa-vectored viral load.
Stores and equipment. Frames of capped honey, frames of pollen, current box configuration, any frames added or removed, and any treatments applied with the application date.
That is roughly 15-20 data points per inspection. With a pre-structured sheet, filling it in takes five minutes. The First-Year Beekeeper’s Handbook & Journal includes 50 hive inspection log sheets, a 12-month calendar, and a colony record book. It is a strong starting point if you prefer a purpose-built paper format to a blank notebook.
This structured approach to data collection integrates naturally into your inspection routine. Here is how to log each inspection step by step:
-
Prepare your recording materials before suiting up. Write in the date, time, weather, and hive identifier before you approach the hive. Set your clipboard or field notebook somewhere accessible at the hive stand. Do not rely on memory to reconstruct entrance observations after the fact.
-
Record entrance observations before opening the hive. Note traffic level, whether foragers are returning with pollen (a reliable indicator of active brood rearing), dead bees at the entrance, washboarding behavior, or guard bee aggression. These pre-opening observations take 60 seconds and frequently contain diagnostic information that disappears once you start working frames.
-
Note the initial bee response to smoke and lid removal. Bees that calmly move away from smoke and settle between frames are behaving normally. Bees that immediately run toward you, cluster, or fan aggressively before you have done anything are showing you something worth recording.
-
Work frames in order and log as you go, not afterward. Start from the outer wall and move toward the center of the brood nest. On each brood frame, evaluate egg presence, larval age, capped brood pattern, and whether you see the queen. Mark your queen sighting on the sheet immediately when you have checked the primary brood frames.
-
Evaluate stores and equipment state on each frame. Note honey and pollen coverage as you work through the box. “Seemed like a lot of honey” is useless data three weeks later when you are deciding whether to feed before a fall dearth.
-
Close the hive and complete your notes while still at the stand. Fill in any fields left blank during the inspection. Write down action items: add a super, schedule a mite wash, check for queen development in ten days. These follow-up flags are the most actionable output of a log and the first thing dropped when notes are deferred until later.
-
Transfer any weight or temperature readings to the same log entry. If you weigh the hive or read probe temperatures on the same day, record those numbers alongside the visual data. Keeping all data for a given date in one entry makes trend analysis far more efficient.
Enhancing Your System: Quantitative Data and Format Choices
Visual inspections capture what you can observe with the hive open. Hive weight and internal temperature capture different signals without disturbing the colony at all, and both integrate naturally into a logging system.
Hive weight tracking. A colony in a strong nectar flow gains 3-5 lbs per day or more. A colony that is static or declining in weight during peak forage, with no other obvious management explanation, is worth a closer look. Weight also gives you the most objective measure of winter stores: most temperate-climate overwintering colonies need 60-80 lbs of honey going into fall, and weekly weight readings tell you clearly whether you are building toward that target.
You do not need a specialized apiary scale to start. A bathroom scale placed under the hive for a consistent weekly weigh-in gives you trend data that is genuinely useful. The Vitafit Bathroom Scale reads to 0.1 lb accuracy with a capacity of 400 lbs. The key is consistency: weigh on the same day of the week, at the same time of day, and log the number alongside your other entries.
Internal temperature monitoring. A healthy brood nest runs 93-95°F (34-35°C). Significant deviation can indicate queen failure, collapse of the nursing population, or winter cluster stress. A multi-probe thermometer with remote logging capability lets you monitor temperature across hive levels without opening the hive. The INKBIRD WiFi Meat Thermometer includes four probes and connects wirelessly to your phone via WiFi. Thread probes through the entrance reducer gap or between box joints and log the readings as a regular entry in your system.
Neither measurement replaces a visual inspection. Together, they add a quantitative layer that reveals colony trends your eyes cannot access from outside the hive.
With these enhanced data points captured, the next step is choosing a format that lets you record all of this information consistently and review it effectively.
The best logging format is the one you will maintain consistently through the tired inspections, the rushed visits, and the defensive hives that make you want to close up and go inside. Here is an honest comparison of the main options.
Paper and pre-printed log sheets require no setup, work without cell service or battery life, and survive being set next to a lit smoker. The downside is that trend analysis means flipping pages and comparing by hand, and notes written in a hurry at the hive stand can be difficult to read days later. Structured pre-printed sheets solve the legibility problem by replacing free-form writing with checkboxes and short fill-ins. The First-Year Beekeeper’s Handbook & Journal includes hive inspection log sheets and a colony record book for the backyard apiary. A physical journal also has zero learning curve, which matters in your first season.
Dedicated apps (HiveTracks, ApiaryBook, Hive Manager) offer automatic date-stamping, photo attachment, and built-in trend charts. They are most useful when managing four or more colonies, where cross-hive comparisons are frequent. The practical friction is data entry while wearing gloves, and apps introduce device-management obligations that some beekeepers find more trouble than they are worth.
Spreadsheets (Google Sheets or Excel) sit between the two. Custom fields, trend charts, and easy search capability are all available. A basic template with the fields described in the previous section takes about 30 minutes to build and can be duplicated for each new colony or season.
One structural recommendation regardless of format: keep quantitative measurements (mite wash results, weight readings, temperature logs) separate from narrative inspection notes. They serve different analytical purposes and are far easier to chart and compare when they are not embedded in paragraph-form observations.
Turning Your Inspection Log Into a Colony Management Tool
Data collected but never reviewed is paperwork, not a monitoring system. The value of inspection logs comes from comparison over time, and that requires building review into your management routine rather than treating it as an occasional activity.
At the end of your active beekeeping season, typically in late fall after your final full inspection, go through the full season’s records and ask: Did population build through spring and peak appropriately in early summer? Were there any multi-week gaps where eggs were not confirmed, which might indicate a supersedure event that resolved without your intervention? At what varroa load did you treat, and how did the timing align with the trajectory the logs show? Did stores accumulate consistently through the main flow, or did you end up underprepared for the first nectar gap?
For in-season use, the most valuable habit is comparing your current inspection notes to the previous entry before writing your action items. This two-minute step catches changes that are invisible within a single visit: a population that declined by 1.5 frames between inspections, a brood pattern that shifted from solid to moderately spotty, a mite count that moved from 1.5% to 2.8% in three weeks. When your log feeds directly into the specific indicators covered in Early Warning Signs Your Bee Colony Is In Trouble, you will catch most serious problems at the point where you still have multiple management options rather than one emergency intervention.
For multi-colony apiaries, a simple comparison chart showing frames of bees and frames of brood for each hive at each inspection date makes outliers visible immediately. A colony running two frames of brood while its neighbors run six is a problem signal whether or not you noticed it during the inspection itself.
Common Inspection Log Mistakes That Cost Colonies
The most common inspection log failure is not refusing to start one. Most beekeepers begin with genuine intention. The failure is the gradual degradation of detail as the season wears on, until the log becomes a record of visits rather than a record of colony state. These are the specific habits that cause that erosion:
Leaving the queen status field blank when she is hard to find. “Queen not seen, eggs present” is useful data. An empty field is not. The distinction between “searched 15 minutes, no queen located, fresh eggs visible” and “queen seen, marked, actively laying” is exactly what you need when making a split or investigating a possible queenless situation three weeks later. Fill the field every time, even when the answer is uncertainty.
Describing brood pattern with vague language. “Brood looks okay” is meaningless when you re-read it two months later. “Three frames of capped worker brood, approximately 80% solid pattern, eggs visible on two center frames, no visible disease signs” gives you something to compare. Brood pattern quality is the most consistently degraded field in paper logs and the one most worth being disciplined about from the first inspection forward.
Omitting weather context. Temperature, cloud cover, and wind level take five seconds to record and make every temperament observation interpretable. A defensive hive on a cold overcast morning is normal. The same behavior on a warm sunny afternoon in July warrants investigation. Without weather context, you cannot evaluate what the observation actually means.
Logging action items without a follow-up system. “Consider adding a super” written at the bottom of a log entry and never encountered again is not management. Action items need to live somewhere you will see them before your next inspection: a dedicated follow-up section at the front of the journal, a calendar reminder set at the hive stand, or a note on your equipment storage. The log is not only a record of what happened; it is a prompt for what needs to happen next.
Letting inspection intervals stretch past the colony’s error budget. Penn State Extension’s beekeeping resources and most university apiculture programs recommend inspections every 10-14 days during active season for colonies under active management, and no less than every 21-28 days for stable hives. In late summer, when varroa loads typically peak and queen failures are most likely, a six-week gap between visits is long enough for a healthy colony to go queenless and allow laying workers to become established. Your log’s date column is an accountability check: widening gaps between entries are a management problem, not just a bookkeeping one.
Consistency beats comprehensiveness. A log that captures 15 fields reliably on every inspection is more valuable than one that captures 30 on good days and nothing on rushed ones. Find the minimum viable version of your log that you can maintain through a full season, and make that your standard.
FAQ: Hive Inspection Logs
How often should I be logging inspections? During the active beekeeping season (roughly April through September in most temperate U.S. climates), plan on a logged inspection every 10-14 days for colonies you are actively managing and every 21-28 days at minimum for stable hives you are monitoring but not working intensively. The shorter interval matters most in late summer when varroa populations typically peak and queen failure risk is elevated. During winter, full visual inspection is neither possible nor advisable in cold climates, but logging weekly hive weight and monthly entrance observations keeps your records continuous and provides comparison data when you open the hive in early spring for your first full assessment.
Should I keep separate logs for each hive? Yes, particularly once you manage more than one colony. When you need to see all inspection entries for a specific hive across an entire season (which happens constantly when deciding whether to split, combine, or treat), per-colony records are far faster to navigate than a combined log that mixes data from multiple hives. If you use a paper journal, dedicate separate sections or separate notebooks per colony. If you use a spreadsheet, use separate tabs. The First-Year Beekeeper’s Handbook & Journal includes hive inspection log sheets and a colony record book for the backyard apiary.
My logs have gaps from missed inspections. How should I handle that? Fill in what you can reconstruct from memory and flag those entries clearly as estimates rather than contemporaneous observations. More importantly, use the gap diagnostically: what is the colony’s current state compared to where it was at your last reliable entry, and what does the trajectory imply about the intervening weeks? A colony that went from eight frames of bees to five during an undocumented six-week stretch is telling you something meaningful even if you cannot pinpoint the specific week. Going forward, prioritize resuming your inspection cadence over comprehensive backfilling. A handful of reliable entries going forward are more useful than an elaborate reconstruction of uncertain history.
Is it worth adding photos to my inspection logs? Yes, selectively. Photos are most useful for documenting brood pattern quality and suspected disease symptoms. An image of a spotty, sunken-capped brood frame attached to an inspection entry lets you compare visually with the same colony six weeks later in a way written descriptions alone cannot support. Many digital logging apps support photo attachment directly. For paper-based systems, a consistent file naming convention (date-hive-subject, saved in a dedicated phone folder) links images to written entries without requiring elaborate organization. Reserve photos for observations you intend to track visually over time rather than trying to photograph every frame on every visit.
Conclusion
The difference between a beekeeper who sees a problem developing and one who discovers it after the fact comes down almost entirely to what was being tracked between inspections. Queen status, brood pattern quality, population trend, mite load trajectory, and resource levels recorded consistently across a season give you a management tool that memory cannot replicate.
Start with a simple format covering the core fields in this guide. Maintain it through the season, review it at year’s end, and pay attention to what the data reveals about your colonies’ patterns and your own management habits. The patterns you find will directly change your decisions in the following year. Pair your log with a solid understanding of what each metric signals, and you will catch most serious problems while you still have time to act.
If this guide helped you think through your logging system, bookmark it for reference before your next inspection season.
Related Reading